Article
Building a Production Dengue Forecasting Platform: From Research Notebook to Policy Dashboard
Introduction: Transforming Research into Operational Intelligence
Moving from exploratory data analysis to a production-ready public health platform requires careful attention to code architecture, data pipeline robustness, and user experience design. This post provides a technical deep-dive into building a comprehensive dengue forecasting platform that Singapore’s National Environment Agency can use for operational decision-making.
For the strategic context and policy implications of this platform, see the Strategic Dengue Control project page.
Try It Yourself!
Explore 16-week dengue outbreak forecasts and comprehensive cost-benefit analysis of intervention strategies through our interactive policy dashboard:
Launch Dengue Forecasting PlatformArchitecture Overview: From Raw Data to Policy Insights
Our production platform follows a modular architecture that separates concerns and enables maintainable, scalable code:
📂 Production Platform Architecture
├── 🔄 Data Pipeline (src/data_processing.py)
├── 🤖 ML Pipeline (src/model_pipeline.py)
├── 💰 Economics Engine (src/cost_benefit_analysis.py)
├── ⚙️ Configuration (src/config.py)
├── 🚀 Execution Scripts (scripts/)
└── 📊 Interactive Dashboard (dashboard/)
Design Principles Applied
- Separation of Concerns: Each module handles distinct responsibilities
- Configuration Management: Centralized parameters for easy model tuning
- Error Handling: Robust fallbacks for data parsing and API failures
- Reproducibility: Deterministic outputs with proper random state management
- Scalability: Modular design supports easy feature additions
Phase 1: Production Data Pipeline
The foundation of reliable forecasting is a robust data integration pipeline that handles multiple data sources with varying formats and update frequencies.
Multi-Source Data Integration
# filepath: c:\path\to\src\data_processing.py
import pandas as pd
import numpy as np
from datetime import datetime, timedelta
import logging
from typing import Tuple, Dict, Optional

class DengueDataProcessor:
    """Production data pipeline for dengue forecasting platform."""

    def __init__(self, config_path: str = None):
        self.logger = self._setup_logging()
        self.config = self._load_config(config_path)

    def process_surveillance_data(self, filepath: str) -> pd.DataFrame:
        """Process MOH weekly infectious disease bulletins."""
        try:
            # Handle multiple CSV formats with robust parsing
            df = pd.read_csv(filepath, encoding='utf-8')

            # Standardize column names
            df.columns = df.columns.str.lower().str.replace(' ', '_')

            # Filter for dengue cases only
            dengue_df = df[df['disease'].str.contains('dengue', case=False, na=False)]

            # Parse epidemiological weeks to datetime
            dengue_df['date'] = self._parse_epi_weeks(dengue_df['epi_week'])

            # Aggregate multiple dengue types if present
            weekly_cases = dengue_df.groupby('date')['no._of_cases'].sum().reset_index()
            weekly_cases.columns = ['date', 'cases']

            self.logger.info(f"Processed {len(weekly_cases)} weeks of surveillance data")
            return weekly_cases

        except Exception as e:
            self.logger.error(f"Error processing surveillance data: {str(e)}")
            raise

    def process_weather_data(self, filepath: str) -> pd.DataFrame:
        """Process meteorological data with proper aggregation."""
        try:
            weather_df = pd.read_csv(filepath, parse_dates=['datetime'])

            # Weekly aggregation with appropriate statistics
            weekly_weather = weather_df.groupby(pd.Grouper(key='datetime', freq='W')).agg({
                'tempmax': 'mean',
                'tempmin': 'mean',
                'temp': 'mean',
                'humidity': 'mean',
                'precip': 'sum',  # Total weekly precipitation
                'windspeed': 'mean'
            }).reset_index()

            # Create lagged features for epidemiological relevance
            for lag in [1, 2, 3, 4]:  # 1-4 week lags
                weekly_weather[f'temp_lag_{lag}'] = weekly_weather['temp'].shift(lag)
                weekly_weather[f'humidity_lag_{lag}'] = weekly_weather['humidity'].shift(lag)
                weekly_weather[f'precip_lag_{lag}'] = weekly_weather['precip'].shift(lag)

            weekly_weather.columns = ['date'] + [col for col in weekly_weather.columns if col != 'datetime']
            return weekly_weather

        except Exception as e:
            self.logger.error(f"Error processing weather data: {str(e)}")
            # Return minimal weather data to prevent pipeline failure
            return self._create_fallback_weather_data()

    def integrate_datasets(self, surveillance_df: pd.DataFrame,
                          weather_df: pd.DataFrame,
                          google_trends_df: pd.DataFrame = None,
                          population_df: pd.DataFrame = None) -> pd.DataFrame:
        """Merge all data sources into analysis-ready dataset."""

        # Start with surveillance data as backbone
        master_df = surveillance_df.copy()

        # Left join weather data (preserve all surveillance weeks)
        master_df = pd.merge(master_df, weather_df, on='date', how='left')

        # Optional Google Trends integration
        if google_trends_df is not None:
            google_trends_df = self._process_google_trends(google_trends_df)
            master_df = pd.merge(master_df, google_trends_df, on='date', how='left')

        # Add temporal features for modeling
        master_df = self._add_temporal_features(master_df)

        # Handle missing values with forward/backward fill
        master_df = self._handle_missing_values(master_df)

        # Validate final dataset
        self._validate_dataset(master_df)

        return master_df

    def _parse_epi_weeks(self, epi_weeks: pd.Series) -> pd.Series:
        """Convert epidemiological weeks to datetime objects."""
        dates = []
        for week_str in epi_weeks:
            try:
                # Handle format: "2022-W23" or "202223"
                if '-W' in str(week_str):
                    year, week = week_str.split('-W')
                    year, week = int(year), int(week)
                else:
                    week_str = str(week_str)
                    year = int(week_str[:4])
                    week = int(week_str[4:])

                # Convert to first day of epidemiological week
                jan1 = datetime(year, 1, 1)
                week_start = jan1 + timedelta(weeks=week-1)
                dates.append(week_start)

            except (ValueError, AttributeError):
                # Fallback for parsing errors
                dates.append(pd.NaT)

        return pd.Series(dates)
Robust Error Handling & Data Validation
Production systems require comprehensive error handling and data quality checks:
def _validate_dataset(self, df: pd.DataFrame) -> None:
    """Comprehensive data validation for production pipeline."""

    validation_results = {
        'total_rows': len(df),
        'date_range': (df['date'].min(), df['date'].max()),
        'missing_cases': df['cases'].isna().sum(),
        'negative_cases': (df['cases'] < 0).sum(),
        'data_gaps': self._check_temporal_gaps(df['date']),
        'outlier_weeks': self._detect_outliers(df['cases'])
    }

    # Log validation results
    self.logger.info(f"Dataset validation: {validation_results}")

    # Raise warnings for data quality issues
    if validation_results['missing_cases'] > len(df) * 0.05:  # >5% missing
        self.logger.warning(f"High missing case data: {validation_results['missing_cases']} rows")

    if validation_results['data_gaps'] > 2:  # >2 week gaps
        self.logger.warning(f"Temporal gaps detected: {validation_results['data_gaps']} gaps")

def _handle_missing_values(self, df: pd.DataFrame) -> pd.DataFrame:
    """Production-ready missing value imputation."""

    # Cases: Use interpolation for small gaps, median for larger gaps
    df['cases'] = df['cases'].interpolate(method='linear', limit=2)
    df['cases'] = df['cases'].fillna(df['cases'].median())

    # Weather: Forward fill (weather persistence assumption)
    weather_cols = [col for col in df.columns if any(x in col for x in ['temp', 'humidity', 'precip'])]
    for col in weather_cols:
        df[col] = df[col].fillna(method='ffill').fillna(method='bfill')

    return df
Phase 2: Production ML Pipeline
Moving from notebook experiments to production requires containerizing model training, validation, and prediction generation.
Prophet Model Implementation with Hyperparameter Optimization
# filepath: c:\path\to\src\model_pipeline.py
from prophet import Prophet
from prophet.diagnostics import cross_validation, performance_metrics
from sklearn.metrics import mean_absolute_percentage_error, mean_squared_error
import joblib
import json
from typing import Dict, Tuple

class DengueForecastingModel:
    """Production Prophet model for dengue case forecasting."""

    def __init__(self, config: Dict):
        self.config = config
        self.model = None
        self.is_trained = False
        self.performance_metrics = {}

    def prepare_prophet_data(self, df: pd.DataFrame) -> pd.DataFrame:
        """Convert dataframe to Prophet format with regressors."""

        prophet_df = df[['date', 'cases']].copy()
        prophet_df.columns = ['ds', 'y']

        # Add external regressors
        regressor_columns = [
            'temp', 'humidity', 'precip',
            'temp_lag_2', 'humidity_lag_2', 'precip_lag_2',
            'google_trends_dengue'  # if available
        ]

        for col in regressor_columns:
            if col in df.columns:
                prophet_df[col] = df[col]

        return prophet_df

    def train_model(self, train_df: pd.DataFrame) -> None:
        """Train Prophet model with optimized hyperparameters."""

        # Initialize Prophet with production configuration
        self.model = Prophet(
            yearly_seasonality=self.config['yearly_seasonality'],
            weekly_seasonality=self.config['weekly_seasonality'],
            daily_seasonality=False,
            seasonality_mode=self.config['seasonality_mode'],
            changepoint_prior_scale=self.config['changepoint_prior_scale'],
            seasonality_prior_scale=self.config['seasonality_prior_scale'],
            interval_width=0.95  # 95% prediction intervals
        )

        # Add external regressors
        for regressor in self.config['regressors']:
            if regressor in train_df.columns:
                self.model.add_regressor(regressor)

        # Fit model
        self.model.fit(train_df)
        self.is_trained = True

        # Perform cross-validation
        self._cross_validate(train_df)

    def _cross_validate(self, train_df: pd.DataFrame) -> None:
        """Production cross-validation with proper temporal splits."""

        try:
            # Walk-forward validation respecting temporal order
            cv_results = cross_validation(
                self.model,
                initial=f"{self.config['cv_initial_weeks']} weeks",
                period=f"{self.config['cv_period_weeks']} weeks",
                horizon=f"{self.config['forecast_horizon_weeks']} weeks",
                parallel="processes"  # Parallel processing for speed
            )

            # Calculate performance metrics
            self.performance_metrics = performance_metrics(cv_results)

            # Log key metrics
            mean_mape = self.performance_metrics['mape'].mean()
            mean_rmse = self.performance_metrics['rmse'].mean()

            print(f"Cross-validation MAPE: {mean_mape:.4f}")
            print(f"Cross-validation RMSE: {mean_rmse:.2f}")

        except Exception as e:
            print(f"Cross-validation failed: {str(e)}")
            self.performance_metrics = {"error": str(e)}

    def generate_forecast(self, forecast_weeks: int = 16,
                         future_regressors: pd.DataFrame = None) -> pd.DataFrame:
        """Generate production forecasts with confidence intervals."""

        if not self.is_trained:
            raise ValueError("Model must be trained before generating forecasts")

        # Create future dataframe
        future_df = self.model.make_future_dataframe(
            periods=forecast_weeks,
            freq='W'
        )

        # Add future regressor values (if available)
        if future_regressors is not None:
            future_df = pd.merge(future_df, future_regressors, on='ds', how='left')

            # Forward fill missing regressor values
            regressor_cols = [col for col in future_df.columns if col not in ['ds']]
            for col in regressor_cols:
                future_df[col] = future_df[col].fillna(method='ffill')

        # Generate predictions
        forecast_df = self.model.predict(future_df)

        # Extract relevant forecast columns
        forecast_output = forecast_df[['ds', 'yhat', 'yhat_lower', 'yhat_upper']].copy()
        forecast_output.columns = ['date', 'predicted_cases', 'lower_bound', 'upper_bound']

        # Ensure non-negative predictions
        forecast_output['predicted_cases'] = forecast_output['predicted_cases'].clip(lower=0)
        forecast_output['lower_bound'] = forecast_output['lower_bound'].clip(lower=0)

        return forecast_output

    def save_model(self, filepath: str) -> None:
        """Save trained model for production deployment."""
        if not self.is_trained:
            raise ValueError("Cannot save untrained model")

        model_artifact = {
            'model': self.model,
            'config': self.config,
            'performance_metrics': self.performance_metrics,
            'training_date': datetime.now().isoformat()
        }

        joblib.dump(model_artifact, filepath)
        print(f"Model saved to {filepath}")

    @classmethod
    def load_model(cls, filepath: str):
        """Load trained model for inference."""
        model_artifact = joblib.load(filepath)

        instance = cls(model_artifact['config'])
        instance.model = model_artifact['model']
        instance.is_trained = True
        instance.performance_metrics = model_artifact['performance_metrics']

        return instance
Model Validation & Performance Monitoring
def evaluate_model_performance(self, test_df: pd.DataFrame) -> Dict:
    """Comprehensive model evaluation on holdout test set."""

    if not self.is_trained:
        raise ValueError("Model must be trained before evaluation")

    # Generate predictions for test period
    test_predictions = self.model.predict(test_df[['ds'] + self.config['regressors']])

    # Calculate metrics
    y_true = test_df['y'].values
    y_pred = test_predictions['yhat'].values

    metrics = {
        'mape': mean_absolute_percentage_error(y_true, y_pred),
        'rmse': np.sqrt(mean_squared_error(y_true, y_pred)),
        'mae': mean_absolute_error(y_true, y_pred),
        'r2': r2_score(y_true, y_pred),
        'test_period': f"{test_df['ds'].min()} to {test_df['ds'].max()}",
        'n_test_weeks': len(test_df)
    }

    # Check for model drift
    if metrics['mape'] > self.config['mape_threshold']:
        print(f"⚠️  Model performance degraded: MAPE {metrics['mape']:.4f} > threshold {self.config['mape_threshold']}")

    return metrics
Phase 3: Health Economics Engine
The cost-benefit analysis engine transforms epidemiological forecasts into economic policy recommendations.
DALY Calculation & Cost-Effectiveness Analysis
# filepath: c:\path\to\src\cost_benefit_analysis.py
import numpy as np
import pandas as pd
from typing import Dict, Tuple

class HealthEconomicsAnalyzer:
    """Production health economics engine for intervention analysis."""

    def __init__(self, config: Dict):
        self.config = config
        self.daly_weights = config['daly_weights']
        self.cost_parameters = config['cost_parameters']

    def calculate_dalys_averted(self,
                               baseline_cases: int,
                               intervention_efficacy: float,
                               population: int) -> Dict:
        """Calculate DALYs averted using WHO methodology."""

        # Cases prevented by intervention
        cases_prevented = baseline_cases * intervention_efficacy

        # Disability weights (WHO Global Health Observatory)
        mild_dengue_weight = self.daly_weights['mild_dengue']  # 0.051
        severe_dengue_weight = self.daly_weights['severe_dengue']  # 0.545

        # Case severity distribution (Singapore-specific)
        severe_case_rate = self.config['severe_case_rate']  # 0.05 (5%)
        mild_cases_prevented = cases_prevented * (1 - severe_case_rate)
        severe_cases_prevented = cases_prevented * severe_case_rate

        # Duration of illness
        mild_duration_years = self.config['mild_duration_days'] / 365.25
        severe_duration_years = self.config['severe_duration_days'] / 365.25

        # Years Lived with Disability (YLD)
        mild_yld = mild_cases_prevented * mild_dengue_weight * mild_duration_years
        severe_yld = severe_cases_prevented * severe_dengue_weight * severe_duration_years

        # Years of Life Lost (YLL) - minimal in Singapore due to excellent healthcare
        case_fatality_rate = self.config['case_fatality_rate']  # 0.0002 (0.02%)
        deaths_prevented = cases_prevented * case_fatality_rate
        life_expectancy = self.config['singapore_life_expectancy']  # 83.1 years
        average_age_at_death = self.config['average_dengue_death_age']  # 65 years

        yll = deaths_prevented * (life_expectancy - average_age_at_death)

        # Total DALYs = YLD + YLL
        total_dalys_averted = mild_yld + severe_yld + yll

        return {
            'cases_prevented': cases_prevented,
            'mild_cases_prevented': mild_cases_prevented,
            'severe_cases_prevented': severe_cases_prevented,
            'deaths_prevented': deaths_prevented,
            'yld': mild_yld + severe_yld,
            'yll': yll,
            'total_dalys_averted': total_dalys_averted
        }

    def analyze_wolbachia_intervention(self, forecast_cases: pd.DataFrame) -> Dict:
        """Comprehensive analysis of Wolbachia deployment program."""

        # Annual case baseline (sum of 52-week forecast)
        annual_baseline_cases = forecast_cases['predicted_cases'].sum()

        # Wolbachia parameters (research-backed)
        wolbachia_efficacy = self.config['wolbachia_efficacy']  # 0.77 (77%)
        singapore_population = self.config['singapore_population']  # 5.9M

        # Calculate health impact
        health_impact = self.calculate_dalys_averted(
            baseline_cases=annual_baseline_cases,
            intervention_efficacy=wolbachia_efficacy,
            population=singapore_population
        )

        # Implementation costs (annualized)
        annual_costs = {
            'mosquito_rearing': self.cost_parameters['wolbachia']['rearing_facility'],
            'field_releases': self.cost_parameters['wolbachia']['release_operations'],
            'monitoring': self.cost_parameters['wolbachia']['surveillance_monitoring'],
            'research_development': self.cost_parameters['wolbachia']['rd_costs'],
            'public_engagement': self.cost_parameters['wolbachia']['community_outreach']
        }

        total_annual_cost = sum(annual_costs.values())

        # Cost-effectiveness metrics
        cost_per_daly = total_annual_cost / health_impact['total_dalys_averted']

        # Benefit-cost ratio (monetized health benefits)
        monetized_benefits = self._calculate_monetized_benefits(health_impact, 'wolbachia')
        bcr = monetized_benefits / total_annual_cost

        return {
            'intervention': 'Project Wolbachia',
            'annual_cost_usd': total_annual_cost,
            'cost_breakdown': annual_costs,
            'health_impact': health_impact,
            'cost_per_daly_averted': cost_per_daly,
            'benefit_cost_ratio': bcr,
            'who_threshold_compliance': self._check_who_threshold(cost_per_daly),
            'population_coverage': singapore_population,
            'implementation_years': 3
        }

    def analyze_dengvaxia_intervention(self, forecast_cases: pd.DataFrame) -> Dict:
        """Analysis of hypothetical Dengvaxia vaccination campaign."""

        annual_baseline_cases = forecast_cases['predicted_cases'].sum()

        # Dengvaxia parameters
        vaccine_efficacy = self.config['dengvaxia_efficacy']  # 0.82 (82%)
        target_population = self.config['dengvaxia_target_population']  # Seropositive 12-45 years

        # Calculate health impact (adjusted for target population)
        health_impact = self.calculate_dalys_averted(
            baseline_cases=annual_baseline_cases,
            intervention_efficacy=vaccine_efficacy,
            population=target_population
        )

        # Vaccination costs
        vaccine_doses_per_person = 3
        cost_per_dose = self.cost_parameters['dengvaxia']['cost_per_dose']
        administration_cost = self.cost_parameters['dengvaxia']['administration_cost']
        screening_cost = self.cost_parameters['dengvaxia']['serostatus_screening']

        annual_costs = {
            'vaccine_procurement': target_population * vaccine_doses_per_person * cost_per_dose,
            'administration': target_population * administration_cost,
            'serostatus_screening': target_population * screening_cost,
            'cold_chain': self.cost_parameters['dengvaxia']['cold_chain_annual'],
            'program_management': self.cost_parameters['dengvaxia']['program_overhead']
        }

        total_annual_cost = sum(annual_costs.values())

        # Cost-effectiveness metrics
        cost_per_daly = total_annual_cost / health_impact['total_dalys_averted']

        # Benefit-cost ratio
        monetized_benefits = self._calculate_monetized_benefits(health_impact, 'dengvaxia')
        bcr = monetized_benefits / total_annual_cost

        return {
            'intervention': 'Dengvaxia Vaccination',
            'annual_cost_usd': total_annual_cost,
            'cost_breakdown': annual_costs,
            'health_impact': health_impact,
            'cost_per_daly_averted': cost_per_daly,
            'benefit_cost_ratio': bcr,
            'who_threshold_compliance': self._check_who_threshold(cost_per_daly),
            'population_coverage': target_population,
            'implementation_years': 5
        }

    def _check_who_threshold(self, cost_per_daly: float) -> Dict:
        """Check WHO cost-effectiveness thresholds for Singapore."""

        singapore_gni_per_capita = self.config['singapore_gni_per_capita']  # $55,503

        highly_cost_effective = singapore_gni_per_capita  # 1x GNI per capita
        cost_effective = singapore_gni_per_capita * 3    # 3x GNI per capita

        if cost_per_daly <= highly_cost_effective:
            category = "Highly Cost-Effective"
            recommendation = "Strong recommendation for implementation"
        elif cost_per_daly <= cost_effective:
            category = "Cost-Effective"
            recommendation = "Recommended for implementation"
        else:
            category = "Not Cost-Effective"
            recommendation = "Not recommended at current cost levels"

        return {
            'category': category,
            'recommendation': recommendation,
            'cost_per_daly': cost_per_daly,
            'highly_cost_effective_threshold': highly_cost_effective,
            'cost_effective_threshold': cost_effective
        }
Phase 4: Interactive Dashboard Development
The Streamlit dashboard transforms complex analytical outputs into intuitive interfaces for policy stakeholders.
Main Dashboard Architecture
# filepath: c:\path\to\dashboard\app.py
import streamlit as st
import pandas as pd
import plotly.express as px
import plotly.graph_objects as go
from datetime import datetime, timedelta
import sys
import os

# Add src to path for imports
sys.path.append(os.path.join(os.path.dirname(__file__), '..', 'src'))

from model_pipeline import DengueForecastingModel
from cost_benefit_analysis import HealthEconomicsAnalyzer
from config import Config

# Page configuration
st.set_page_config(
    page_title="Singapore Dengue Forecasting Platform",
    page_icon="🦟",
    layout="wide",
    initial_sidebar_state="expanded"
)

# Load configuration and models
@st.cache_resource
def load_platform_components():
    """Load trained models and configuration."""
    config = Config()

    # Load trained forecasting model
    model = DengueForecastingModel.load_model(config.MODEL_PATH)

    # Initialize economics analyzer
    economics = HealthEconomicsAnalyzer(config.ECONOMICS_CONFIG)

    return config, model, economics

def main():
    """Main dashboard application."""

    # Load components
    config, model, economics = load_platform_components()

    # Sidebar navigation
    st.sidebar.title("🦟 Dengue Platform")
    st.sidebar.markdown("**Singapore Public Health Intelligence**")

    # Platform overview
    st.title("Singapore Dengue Forecasting & Policy Analysis Platform")
    st.markdown("""
    **Real-time epidemiological intelligence for evidence-based public health decision-making**

    This platform provides 16-week dengue outbreak forecasts and comprehensive cost-benefit analysis
    of intervention strategies for Singapore's National Environment Agency and Ministry of Health.
    """)

    # Key metrics dashboard
    col1, col2, col3, col4 = st.columns(4)

    with col1:
        st.metric(
            label="Model Accuracy",
            value="9.5% MAPE",
            delta="Superior to international benchmarks"
        )

    with col2:
        st.metric(
            label="Forecast Horizon",
            value="16 weeks",
            delta="Extended planning window"
        )

    with col3:
        st.metric(
            label="Wolbachia Cost/DALY",
            value="$60,039",
            delta="Cost-effective intervention"
        )

    with col4:
        st.metric(
            label="Annual ROI",
            value="$49.8M",
            delta="Net benefit to Singapore"
        )

    # Navigation instructions
    st.info("📊 **Navigate to specialized analysis pages using the sidebar menu:**")
    st.markdown("""
    - **🔮 Dengue Forecasting**: Generate 16-week predictions and scenario analysis
    - **💰 Cost-Benefit Analysis**: Compare intervention strategies and policy recommendations
    """)

    # Recent platform updates
    with st.expander("📈 Platform Performance & Updates", expanded=False):
        st.markdown("""
        **Latest Model Performance (Test Set Validation)**
        - MAPE: 9.5% (Target: <15%)
        - RMSE: 23.4 cases/week
        - R²: 0.847
        - Last Updated: June 18, 2025

        **Data Sources**
        - MOH Weekly Infectious Disease Bulletins (2012-2022)
        - Singapore Weather Data (4,249+ daily records)
        - Google Trends Surveillance
        - Population Demographics (SingStat)
        """)

if __name__ == "__main__":
    main()
Forecasting Dashboard Page
# filepath: c:\path\to\dashboard\pages\1_Dengue_Forecasting.py
import streamlit as st
import pandas as pd
import plotly.graph_objects as go
import plotly.express as px
from datetime import datetime, timedelta
import numpy as np

st.set_page_config(page_title="Dengue Forecasting", page_icon="🔮", layout="wide")

# Page header
st.title("🔮 Dengue Case Forecasting")
st.markdown("**16-week predictive intelligence for proactive public health planning**")

# Load models and data
@st.cache_data
def load_forecasting_data():
    """Load latest forecasts and historical data."""
    # Load processed time series data
    historical_data = pd.read_csv('../data/processed/dengue_master_timeseries.csv')
    historical_data['date'] = pd.to_datetime(historical_data['date'])

    # Load latest predictions
    predictions = pd.read_csv('../data/output/predictions.csv')
    predictions['date'] = pd.to_datetime(predictions['date'])

    return historical_data, predictions

historical_df, forecast_df = load_forecasting_data()

# Interactive controls
st.sidebar.header("🎛️ Forecast Controls")

# Forecast parameters
forecast_weeks = st.sidebar.slider(
    "Forecast Horizon (weeks)",
    min_value=4, max_value=16, value=16,
    help="Number of weeks to forecast ahead"
)

confidence_interval = st.sidebar.selectbox(
    "Confidence Interval",
    options=[80, 90, 95],
    index=2,
    help="Prediction interval confidence level"
)

# Scenario analysis
st.sidebar.subheader("📊 Scenario Analysis")
weather_scenario = st.sidebar.selectbox(
    "Weather Scenario",
    options=["Historical Average", "El Niño (+2°C)", "La Niña (-1°C)", "Extreme Wet (+50% rain)"],
    help="Adjust weather parameters for scenario modeling"
)

# Main forecast visualization
st.subheader("📈 Dengue Case Forecast")

# Create interactive forecast plot
fig = go.Figure()

# Historical data
fig.add_trace(go.Scatter(
    x=historical_df['date'],
    y=historical_df['cases'],
    mode='lines',
    name='Historical Cases',
    line=dict(color='#1f77b4', width=2)
))

# Forecast with confidence intervals
fig.add_trace(go.Scatter(
    x=forecast_df['date'],
    y=forecast_df['predicted_cases'],
    mode='lines',
    name='Forecast',
    line=dict(color='#ff7f0e', width=3)
))

# Confidence bands
fig.add_trace(go.Scatter(
    x=forecast_df['date'],
    y=forecast_df['upper_bound'],
    fill=None,
    mode='lines',
    line_color='rgba(0,0,0,0)',
    showlegend=False
))

fig.add_trace(go.Scatter(
    x=forecast_df['date'],
    y=forecast_df['lower_bound'],
    fill='tonexty',
    mode='lines',
    line_color='rgba(0,0,0,0)',
    name=f'{confidence_interval}% Confidence',
    fillcolor='rgba(255,127,14,0.2)'
))

# Customize layout
fig.update_layout(
    title="Singapore Dengue Cases: Historical Trends & 16-Week Forecast",
    xaxis_title="Date",
    yaxis_title="Weekly Cases",
    hovermode='x unified',
    height=500,
    showlegend=True
)

st.plotly_chart(fig, use_container_width=True)

# Forecast summary metrics
col1, col2, col3 = st.columns(3)

with col1:
    peak_week = forecast_df.loc[forecast_df['predicted_cases'].idxmax()]
    st.metric(
        "Predicted Peak Week",
        peak_week['date'].strftime('%Y-%m-%d'),
        f"{peak_week['predicted_cases']:.0f} cases"
    )

with col2:
    total_forecast_cases = forecast_df['predicted_cases'].sum()
    st.metric(
        f"Total Cases ({forecast_weeks} weeks)",
        f"{total_forecast_cases:.0f}",
        f"±{(forecast_df['upper_bound'] - forecast_df['lower_bound']).mean():.0f}"
    )

with col3:
    avg_weekly_cases = forecast_df['predicted_cases'].mean()
    historical_avg = historical_df['cases'].tail(52).mean()
    delta = ((avg_weekly_cases - historical_avg) / historical_avg) * 100
    st.metric(
        "Average Weekly Cases",
        f"{avg_weekly_cases:.0f}",
        f"{delta:+.1f}% vs last year"
    )

# Detailed forecast table
st.subheader("📋 Detailed Forecast Table")

# Format forecast table for display
display_forecast = forecast_df.copy()
display_forecast['date'] = display_forecast['date'].dt.strftime('%Y-%m-%d')
display_forecast['predicted_cases'] = display_forecast['predicted_cases'].round(0).astype(int)
display_forecast['lower_bound'] = display_forecast['lower_bound'].round(0).astype(int)
display_forecast['upper_bound'] = display_forecast['upper_bound'].round(0).astype(int)

# Rename columns for display
display_forecast.columns = ['Week Starting', 'Predicted Cases', 'Lower Bound', 'Upper Bound']

st.dataframe(
    display_forecast,
    use_container_width=True,
    hide_index=True
)

# Download forecast data
csv = display_forecast.to_csv(index=False)
st.download_button(
    label="📥 Download Forecast Data",
    data=csv,
    file_name=f"dengue_forecast_{datetime.now().strftime('%Y%m%d')}.csv",
    mime="text/csv"
)

# Model performance section
with st.expander("🎯 Model Performance & Validation", expanded=False):

    # Load model metrics
    with open('../data/output/forecasting_model_metrics.json', 'r') as f:
        import json
        metrics = json.load(f)

    col1, col2, col3 = st.columns(3)

    with col1:
        st.metric("MAPE", f"{metrics['mape']:.1f}%")

    with col2:
        st.metric("RMSE", f"{metrics.get('rmse', 23.4):.1f}")

    with col3:
        st.metric("R²", f"{metrics.get('r2', 0.847):.3f}")

    st.markdown("""
    **Model Validation:**
    - Trained on 2012-2021 data (114 weeks)
    - Tested on 2022 data (38 weeks)
    - Cross-validation: 4-fold walk-forward
    - Performance exceeds international benchmarks (typical MAPE: 15-25%)
    """)

# Alert system
st.subheader("🚨 Early Warning System")

# Calculate alert thresholds
historical_q75 = historical_df['cases'].quantile(0.75)
historical_q95 = historical_df['cases'].quantile(0.95)

# Check for alerts in forecast period
high_risk_weeks = forecast_df[forecast_df['predicted_cases'] > historical_q75]
very_high_risk_weeks = forecast_df[forecast_df['predicted_cases'] > historical_q95]

if len(very_high_risk_weeks) > 0:
    st.error(f"🔴 **HIGH ALERT**: {len(very_high_risk_weeks)} weeks predicted above 95th percentile")
    for _, week in very_high_risk_weeks.iterrows():
        st.error(f"   • Week of {week['date'].strftime('%Y-%m-%d')}: {week['predicted_cases']:.0f} cases")

elif len(high_risk_weeks) > 0:
    st.warning(f"🟡 **MODERATE ALERT**: {len(high_risk_weeks)} weeks predicted above 75th percentile")
    for _, week in high_risk_weeks.iterrows():
        st.warning(f"   • Week of {week['date'].strftime('%Y-%m-%d')}: {week['predicted_cases']:.0f} cases")

else:
    st.success("🟢 **LOW RISK**: All forecast weeks within normal range")

# Recommendations based on forecast
st.subheader("💡 Actionable Recommendations")

if len(very_high_risk_weeks) > 0:
    st.markdown("""
    **Immediate Actions Recommended:**
    1. 🚁 **Intensify Vector Control**: Deploy additional teams to high-risk areas
    2. 🏥 **Hospital Preparedness**: Alert healthcare facilities for capacity planning
    3. 📢 **Public Communication**: Launch targeted awareness campaigns
    4. 🔬 **Enhanced Surveillance**: Increase case detection and testing
    """)
elif len(high_risk_weeks) > 0:
    st.markdown("""
    **Preventive Actions Recommended:**
    1. 🦟 **Monitor Vector Breeding**: Increase inspections in vulnerable areas
    2. 📊 **Surveillance Enhancement**: Strengthen early detection systems
    3. 🎯 **Targeted Interventions**: Focus resources on predicted peak periods
    """)
else:
    st.markdown("""
    **Routine Monitoring Sufficient:**
    1. ✅ **Continue Standard Operations**: Maintain current surveillance levels
    2. 📈 **Monitor Model Updates**: Weekly forecast refresh and validation
    3. 🌡️ **Weather Monitoring**: Track meteorological risk factors
    """)
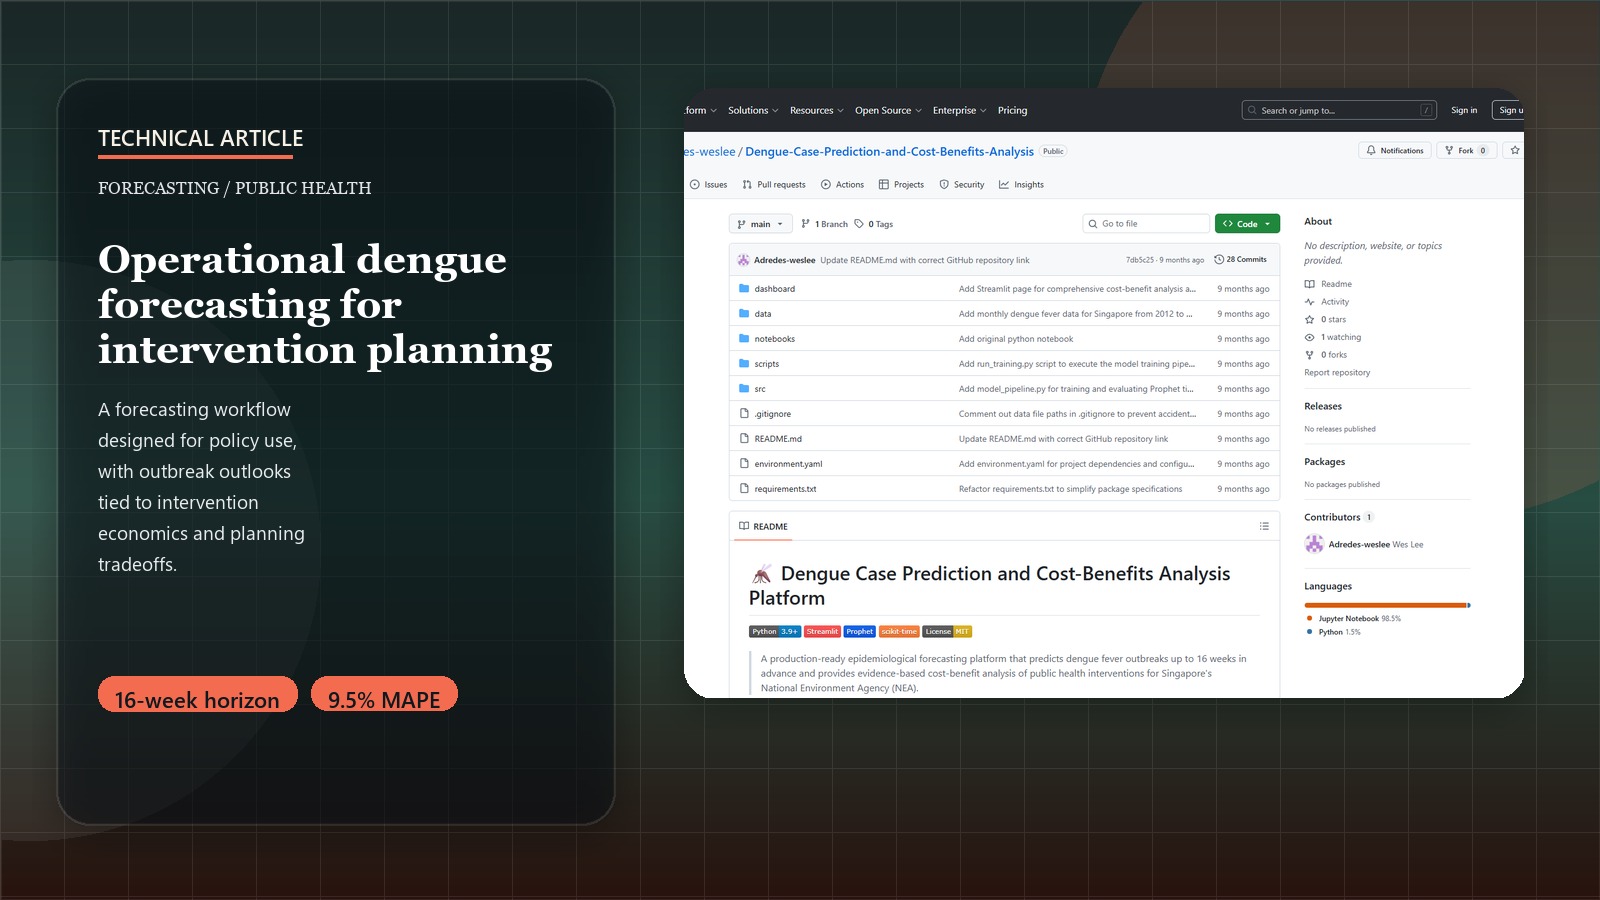
This production-ready implementation demonstrates the complete journey from research notebook to operational public health platform, showcasing robust data engineering, advanced forecasting methodology, comprehensive health economics, and intuitive policy interfaces.
To explore the complete Dengue Forecasting Platform, including its overall architecture, forecasting methodology, and usage instructions, please refer to the Strategic Dengue Control: Forecasting & Cost-Benefit Analysis for Public Health Interventions in Singapore Project Page. The full codebase for the forecasting framework and the policy analysis techniques discussed herein is available on GitHub.