Project
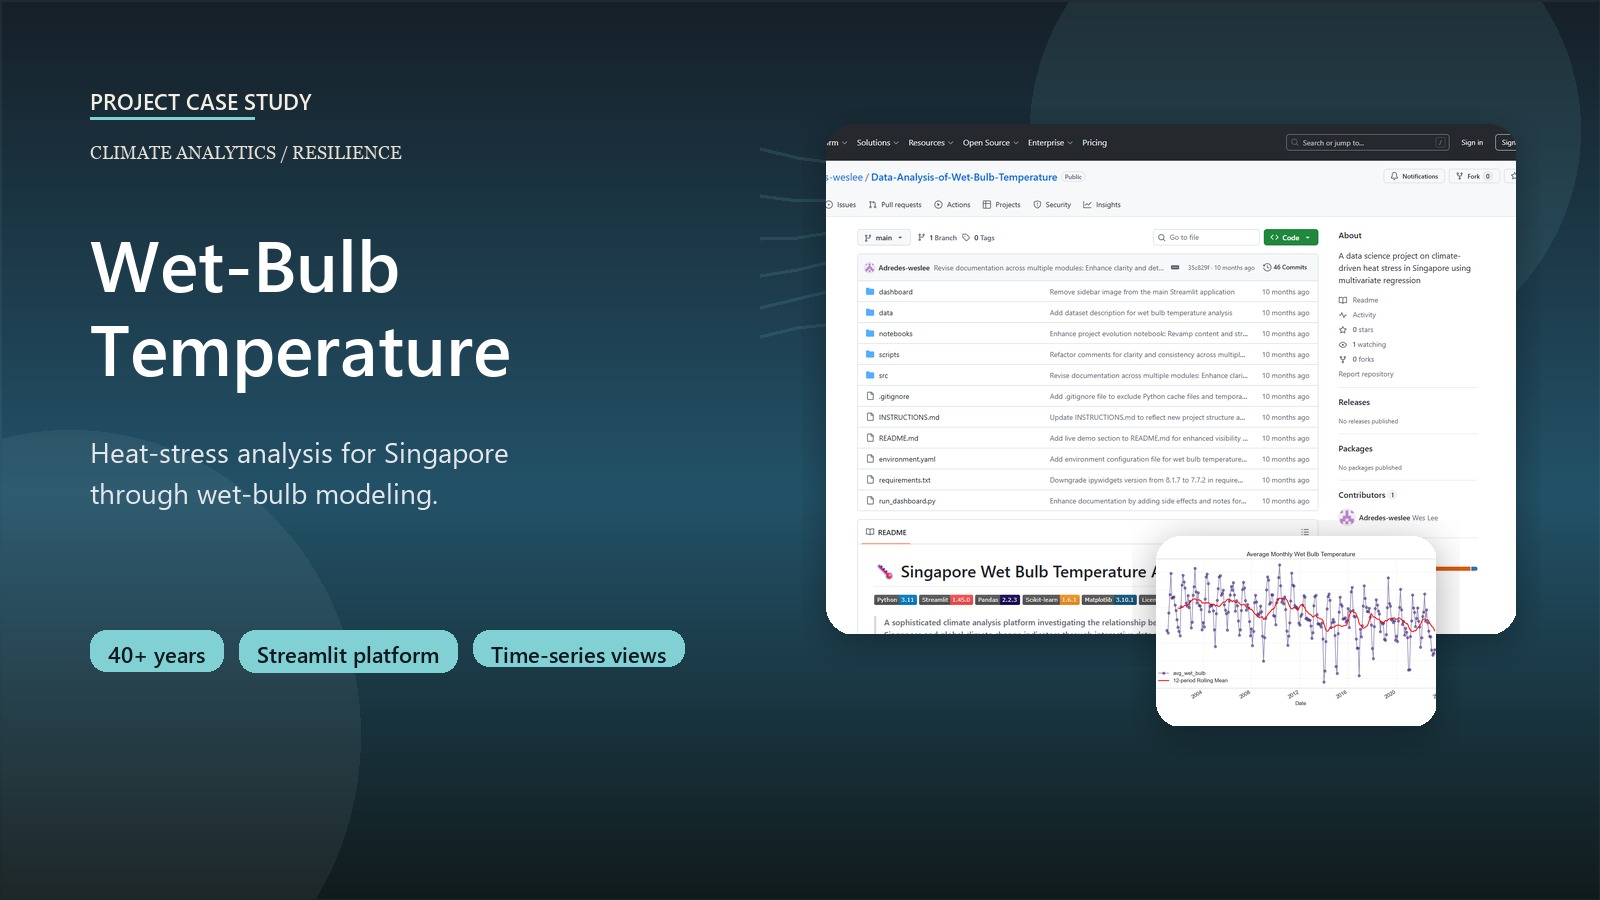
Wet-Bulb Temperature Analysis for Singapore
A Singapore climate analysis platform focused on heat stress, wet-bulb temperature, and resilience signals.
Python Streamlit pandas scikit-learn matplotlib Climate analytics Regression modeling
Business context
Climate dashboards often stop at temperature trends, but heat stress depends on more than dry-bulb temperature alone. This project focused on wet-bulb temperature as the more decision-relevant signal for resilience planning in Singapore.
Outcome
- Merged seven climate and emissions datasets into a unified analysis dataset.
- Converted an academic notebook into a modular Streamlit platform with ETL, modeling, and visualization layers.
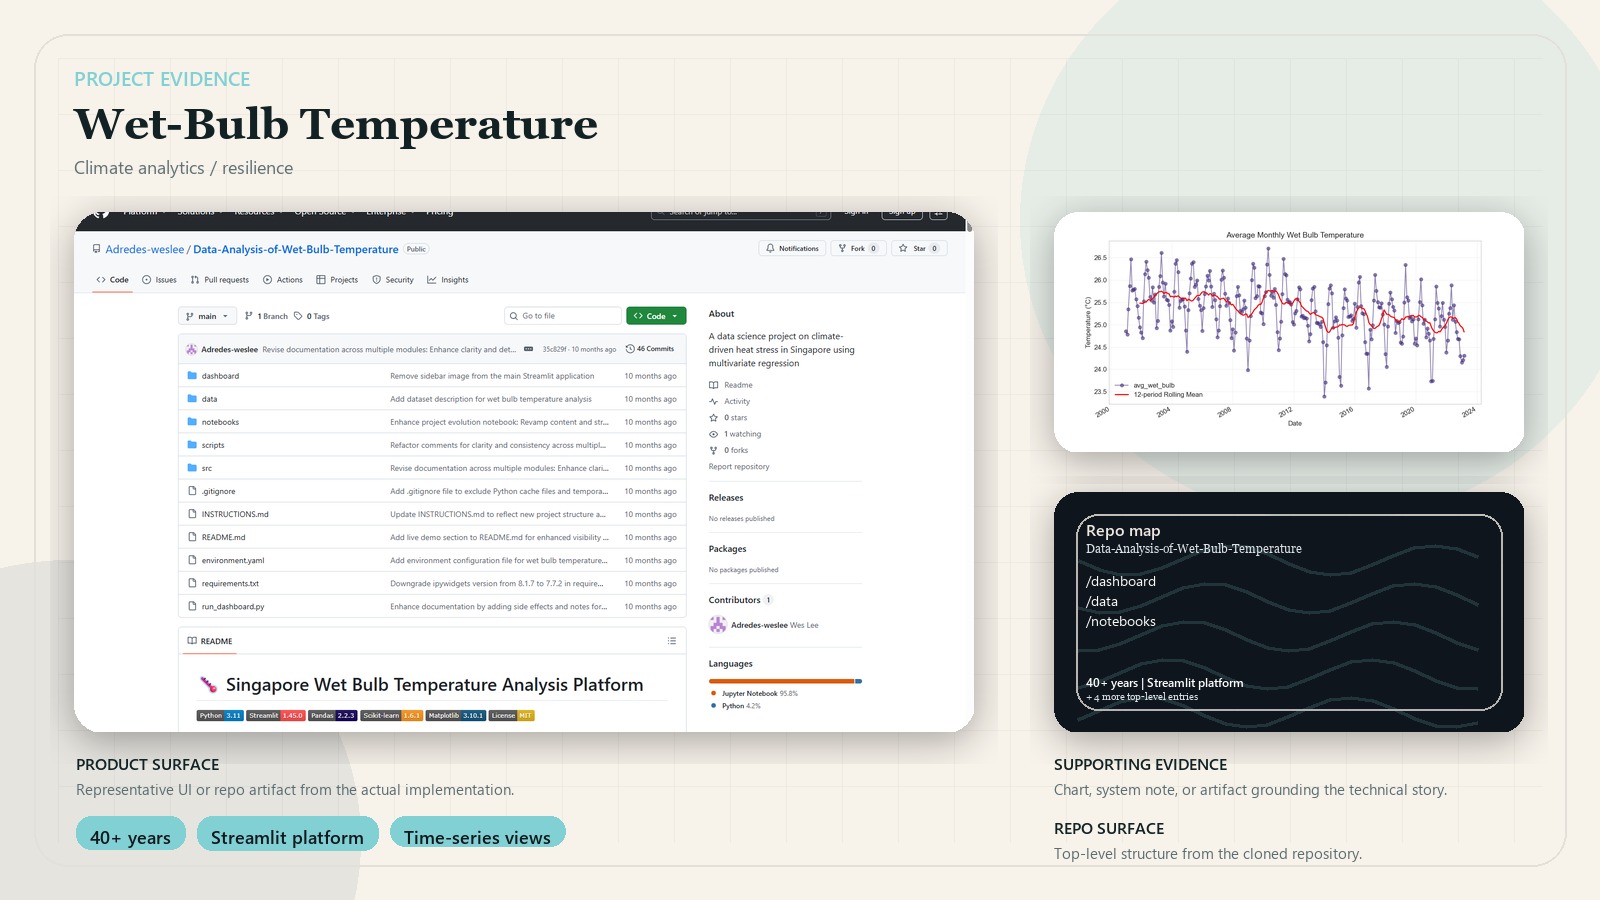
- Covered more than 40 years of climate and greenhouse-gas context for Singapore-focused analysis.
- Produced publication-style visualizations and regression surfaces for exploration.
Key decisions
- Framed the project around wet-bulb temperature instead of generic temperature trends.
- Combined local meteorological variables with broader greenhouse-gas indicators.
- Broke the notebook into reusable modules for data loading, feature engineering, modeling, and visualization.
- Treated the work as both scientific communication and analysis, not just prediction.
System design
Multiple climate and emissions datasets are cleaned into a shared analytical dataset, then passed into feature engineering, regression, and visualization modules. The dashboard layers those outputs into a more usable exploration surface for policy and resilience questions.
Stack
- Python, pandas, scikit-learn, matplotlib, and supporting statistics tooling
- Streamlit for the analysis interface
- Multi-source ETL, feature engineering, regression, and visualization modules